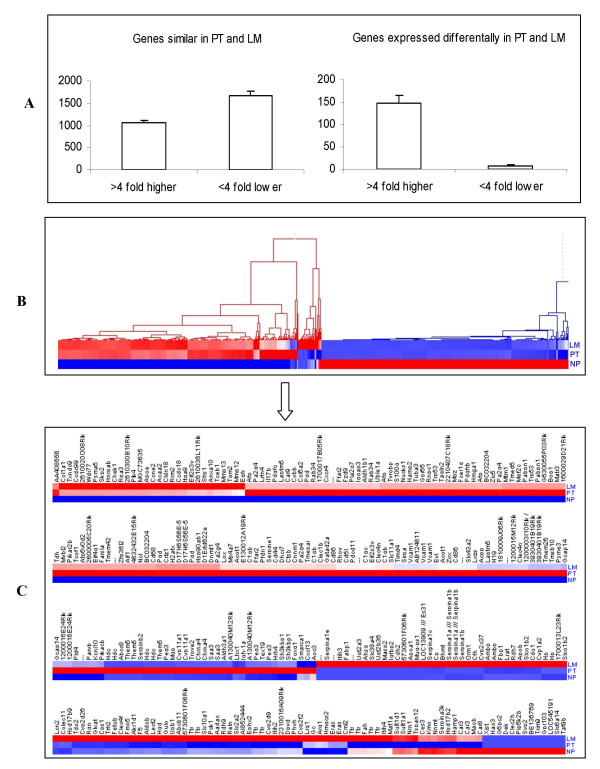
Figure 1.
Gene expression profiles. A) Histogram showing a similar (left) and differential (right) gene expression profiles of primary pancreatic tumors and liver metastatic lesions from Ela-c-Myc transgenic mice compared to normal pancreas from wild type littermates. B) Hierarchical clustering of differentially expressed genes. Clustering tree illustrate the expression pattern and similarity in primary pancreatic tumors (labeled as PT) and liver metastatic lesions (labeled as LM) compared to normal pancreas (labeled as NP) indicated by color bars. C) Shows only the differentially expressed gene profile with at least a four-fold change (≤4 or ≥4) indicated by color bars. (blue-down regulated and red up-regulated).

