
Fig. 4.
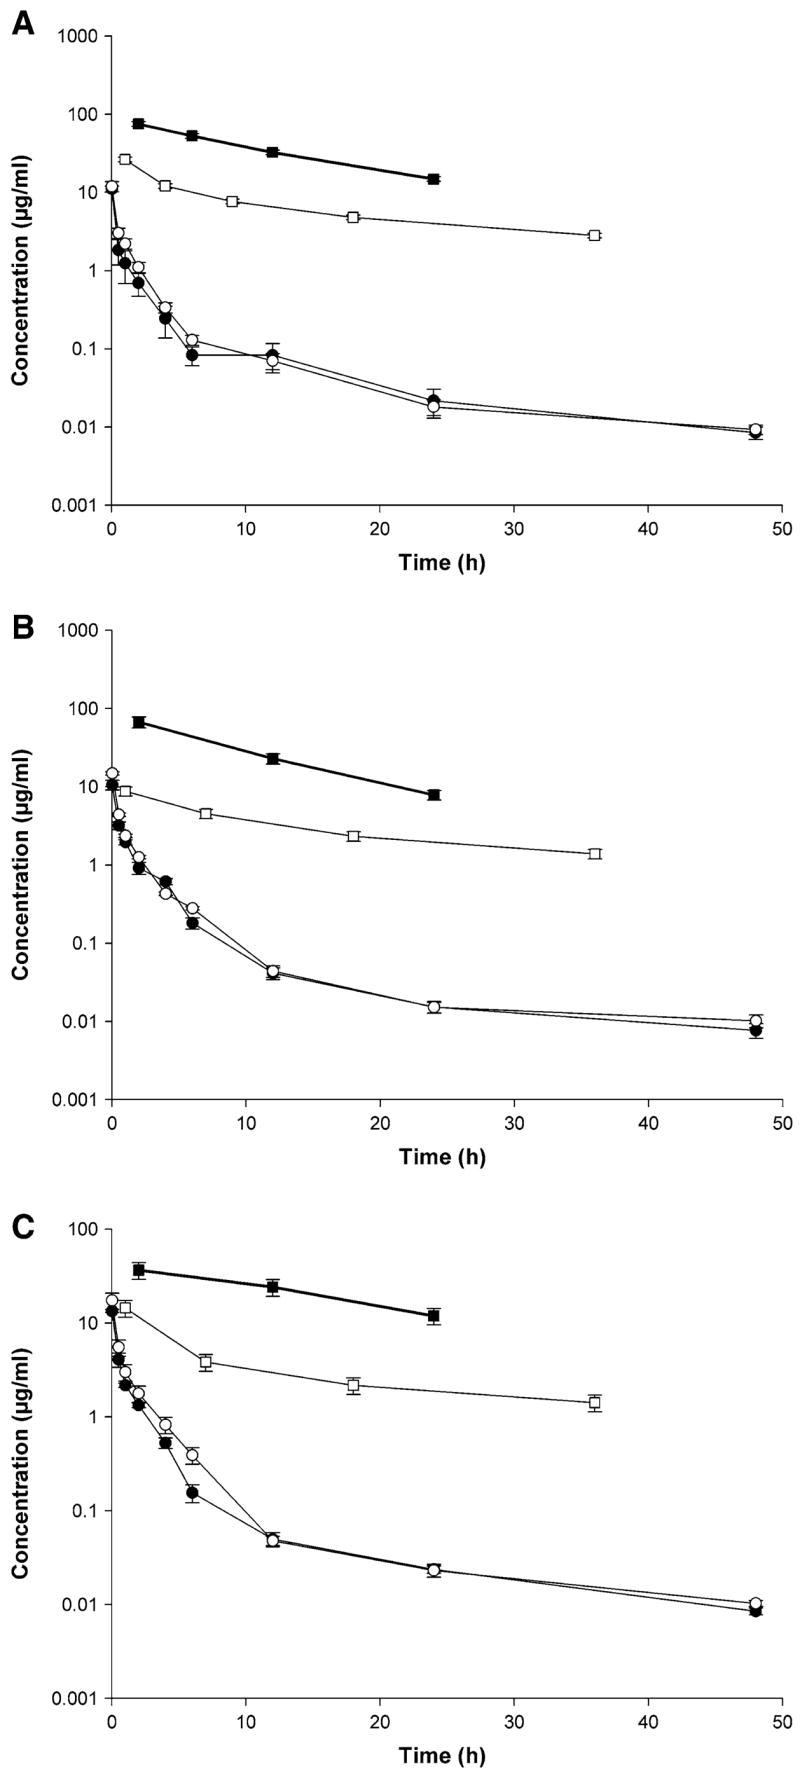
Rapamycin amount remaining to be excreted in urine (ARE) plot (filled square), rate of urinary excretion plot (open square), concentration-time profile in blood (filled circle) and plasma plots (open circle) after IV administration of a) control rapamycin, b) rapamycin in PEG-b-PCL, and c) rapamycin in PEG-b-PCL + α-tocopherol formulation (10 mg/kg) to rats (mean ± SEM, n = 4 per group)