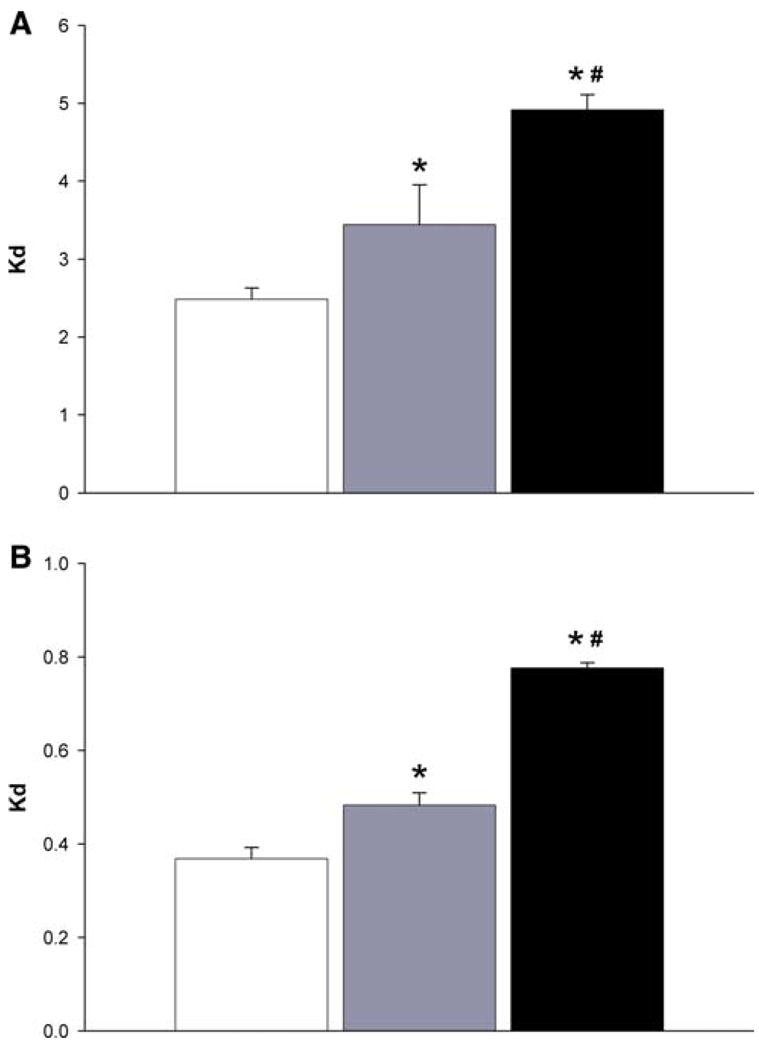
Fig. 6.

Plasma/RBC ratios (Kd) of rapamycin control formulation (open square), rapamycin in PEG-b-PCL (dotted rectangle), and rapa-mycin in PEG-b-PCL + α-tocopherol formulation (filled square) at a) 1 min after IV administration. (n = 4, mean ± SEM) and at b) 24 h after IV administration. (n = 4, mean ± SEM). *Denotes statistical significant difference (P < 0.05) between control and formulation. #Denotes statistical significant difference (P < 0.05) between both formulations
