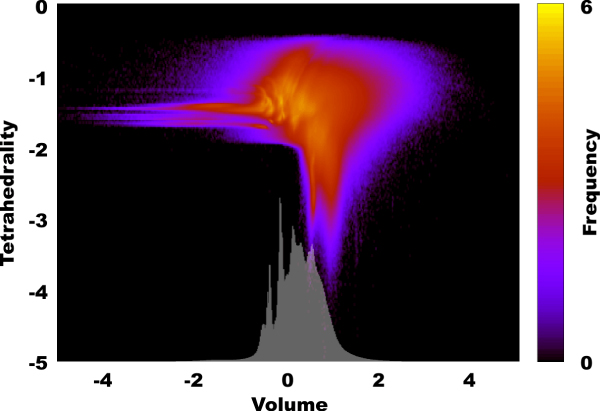
Figure 2.

The triple logarithmic plot of the density of Delaunay regions. A point with coordinates (x, y) on the plot corresponds to all Delaunay regions whose volume is 10(x ± 0.01) and tetrahedrality is 10(y ± 0.01) and the color of the point corresponds to log(z + 1) where z is the number of such regions. The white barplot on the bottom of the image is the same for volume only.
