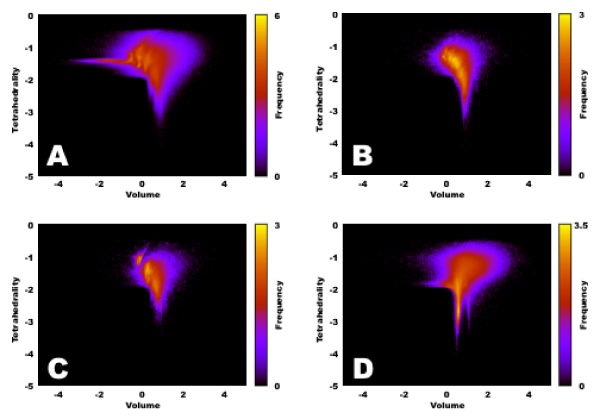
Figure 3.

Separate drawing for different tetrahedra. We give here similar density maps as in Figure 2, but now separately drawn for tetrahedra with vertices C_C_N_O (inset A), C_C_O_S (inset B), C_N_O_S (inset C) and N_N_O_O (inset D). It is clear that different vertex-compositions implies different shape/volume distributions.
