
Fig. 5.
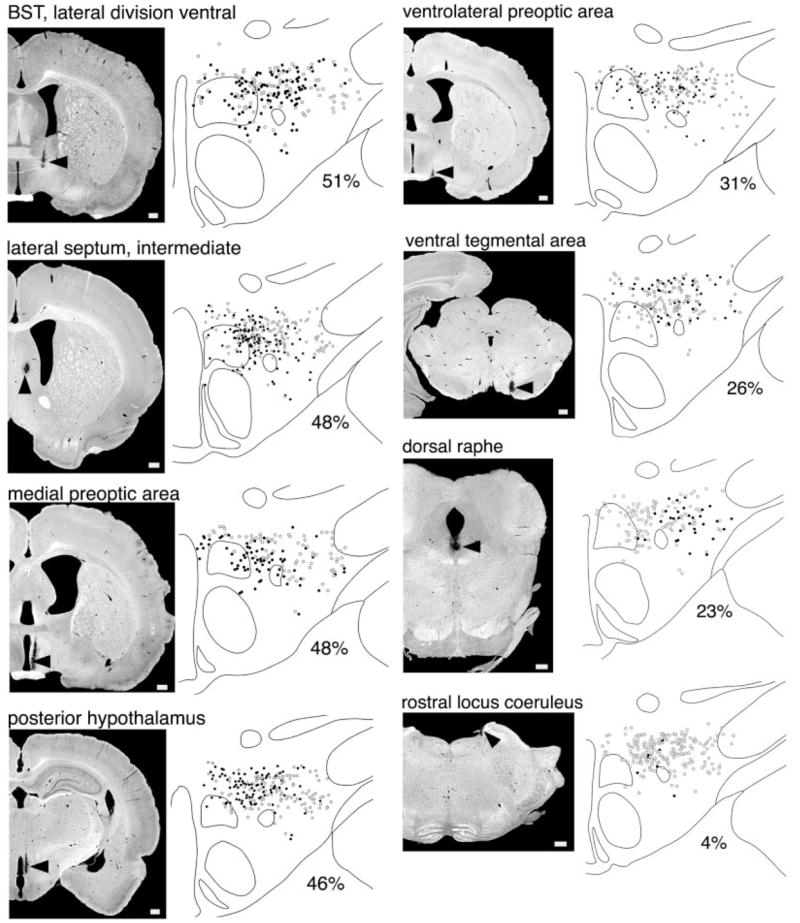
Anterograde labeling of afferents to the orexin neurons from several brain regions. The BD injection site is indicated by an arrow on the darkfield photomicrograph in each left-hand panel. The right-hand panel shows the distribution of orexin-IR neurons: black circles represent orexin neurons receiving appositions from the corresponding injection and white circles indicate orexin neurons with no apparent appositions. Below each drawing is noted the percent of all orexin neurons on that section that receive appositions. Hypothalamic inputs target orexin neurons in the medial and perifornical parts of the orexin field, whereas lighter inputs from brainstem regions tend to innervate orexin neurons in the lateral half of the field. Scale bars in the left panels = 500 μm.