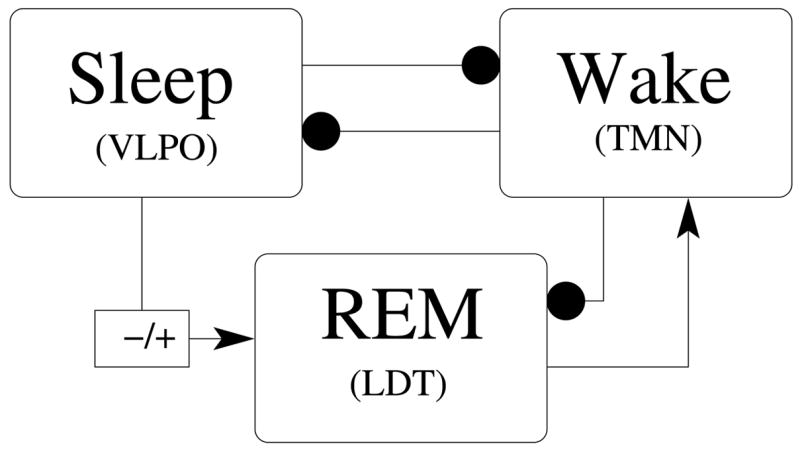
Figure 3.

Summary of model sleep-wake network architecture: filled circles denote inhibitory connections; arrows denote excitatory connections. The sign change on the projection from to represents the net effect of the projection from eVLPO to LDT-PPT: this projection is thought to synapse on inhibitory interneurons in LDT-PPT, thereby disinhibiting the (excitatory) cholinergic neurons in LDT-PPT and exerting a net excitatory effect.
