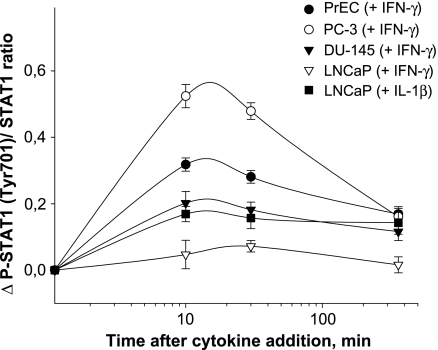
Figure 4.
Signal transducer and activator of transcription-1 (STAT1) phosphorylation induced by IFN-γ in PrEC, PC-3, DU-145, and LNCaP cells. The STAT1 phosphorylation was determined by cell-based ELISA technique. Each point represents the mean of cellular STAT1 activation expressed as the ratio P-STAT1/STAT1 and measured after 0, 10, 30, and 360 minutes of incubation with 25 ng/ml IFN-γ or 25 ng/ml IL-1β. The results are the means ± SD of analysis in triplicate and are representative of three independent experiments.

