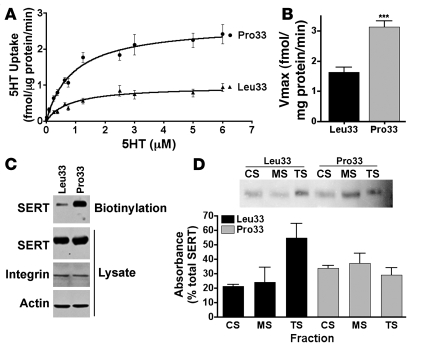
Figure 4. Genetic variation in ITGB3 alters SERT transport activity, surface trafficking, and subcellular localization.
(A) Saturation analyses of HEK293 cells expressing SERT, αIIb, and either the Leu33 or the Pro33 isoforms of integrin β3. Data are presented as mean ± SEM. Two-way ANOVA, P < 0.0001, n = 10. (B) Pro33β3 expression increases SERT Vmax. Unpaired Student’s t test, ***P < 0.0001, n = 10. (C) The increase in SERT Vmax by Pro33β3 is reflected by enhancement of SERT plasma membrane expression. Intact HEK293 cells were exposed to biotin, and surface proteins were captured by streptavidin beads. Surface SERT was detected by Western blot analysis. No significant differences were found in total SERT or αIIbβ3 expression. Representative blot from 3 independent experiments. (D) SERT subcellular distribution in platelets from Leu33 or Pro33 homozygous subjects. Human platelets were fractionated, and CS and MS fractions were collected. SERT is evenly distributed among the CS, MS, and TS compartments in Pro33 subjects. Data are presented as mean ± SEM. Two-way ANOVA, P < 0.05, n = 3 per group.

