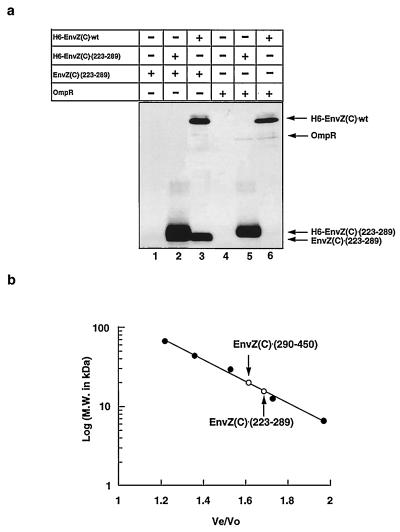
Figure 4.
Analysis of dimerization of EnvZ(C)⋅(223–289) and its interaction with OmpR. (a) The purified proteins were mixed at room temperature for 30 min (lanes 1–3) or 60 min (lanes 4–6) in 20 μl of buffer I [50 mM sodium phosphate (pH 8.0)/0.3 M NaCl/5% glycerol], 10 μl of Ni-NTA resin (50%, vol/vol; Qiagen, Chatsworth, CA) equilibrated with buffer I was added, followed by further incubation for 30 min on ice. After the sample was washed three times with buffer II [50 mM sodium phosphate (pH 6.0)/0.3 M NaCl/5% glycerol], proteins bound to Ni-NTA resin were eluted by 0.2 M imidazole in buffer II. Proteins thus eluted were subjected to SDS/PAGE (20% gel), and the gel was treated by silver staining. Lanes: 1, EnvZ(C)⋅(223–289) (2.5 × 10⁻⁵ M); 2, H6-EnvZ(C)⋅(223–289) and EnvZ(C)⋅(223–289) (2.5 × 10⁻⁵ M each); 3, H6-EnvZ(C)⋅wt and EnvZ(C)⋅(223–289) (2.5 × 10⁻⁵ M each); 4, OmpR (6.1 × 10⁻⁶ M); 5, OmpR (6.1 × 10⁻⁶ M) and H6-EnvZ(C)⋅(223–289) (2.5 × 10⁻⁵ M); 6, OmpR (6.1 × 10⁻⁶ M) and H6-EnvZ(C)⋅wt (2.5 × 10⁻⁵ M). (b) The gel filtration profiles of EnvZ(C)⋅(223–289) and EnvZ(C)⋅(290–450). The migrations of EnvZ(C)⋅(223–289) and EnvZ(C)⋅(290–450) were analyzed by using a TSK-GEL column (Tosohaas) equipped with an HPLC system (model 110B, Beckman). The standard proteins are indicated as closed circles; BSA (66,000 Da), ovalbumin (43,000 Da), carbonic anhydrase (29,000 Da), cytochrome c (12, 400 Da), and CspA (7, 400 Da). The proteins of EnvZ(C)⋅(223–289) and EnvZ(C)⋅(290–450) are indicated by open circles and arrows. The y axis represents the molecular mass (kDa) in a log scale; the x axis represents the ratio of the elution volume of sample (Ve) to the void volume (Vo).

