Figure 2.
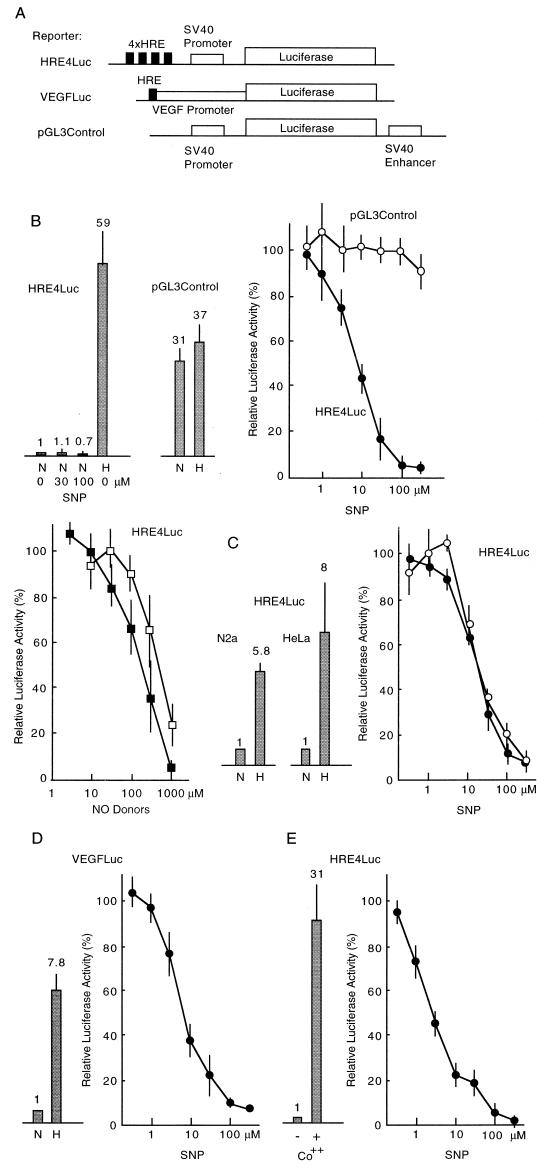
Inhibition of reporter activity containing HRE by NO donors. (A) Structure of reporter plasmids used in the experiments. (B) Induction ratio of luciferase activity of HRE4Luc and pGL3Control reporters from normoxic to hypoxic Hep3B cells is shown (bars with SD). Dose-dependent inhibition curves of luciferase activity in hypoxic cells by NO donors are shown at right. •, Luciferase activity of HRE4Luc treated with SNP; ○, pGL3Control with SNP; ▪, HRE4Luc with S-nitroso-l-glutathione; □, HRE4Luc with SIN-1. (C) Induction ratios in Neuro 2A and HeLa cells are shown (bars with SD). Dose-dependent inhibition curves by SNP are shown at right. • and ○ for Neuro 2A and HeLa cells, respectively. (D) Induction ratio of luciferase activity from the VEGF-luciferase expression plasmid is shown (bars with SD). Dose-dependent inhibition curves by SNP are shown at right. (E) Induction ratios by CoCl2 are shown (bars with SD). Dose-dependent inhibition curves of CoCl2-induced luciferase expression by SNP are shown at right. A mixture of a reporter plasmid (2 μg) and an internal control plasmid of lac Z (3 μg) was used for transfection of Hep3B cells in 60-mm dishes. N, normoxia; H, hypoxia.

