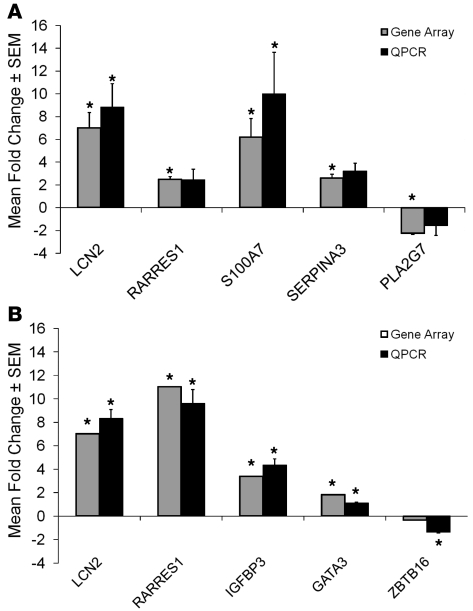
Figure 2. QPCR verification of gene array changes.
In order to verify the direction and magnitude of the changes in gene expression induced by 13-cis RA in the gene microarrays, QPCR was performed using primers to select genes whose expression was significantly changed by 13-cis RA in the array analysis. (A) Comparison of array analysis and QPCR on RNA obtained from patient skin biopsies at baseline and 1 week of 13-cis RA treatment. Data represent the mean ± SEM of the fold change in gene expression as determined by QPCR in 5 subjects compared to array analysis performed in 6 subjects. RARRES1, retinoic acid receptor responder 1; S100A7, psoriasin; SERPINA3, serine proteinase inhibitor A3; PLA2G7, phospholipase A2 group 7. (B) Comparison of array analysis and QPCR on RNA obtained from SEB-1 sebocytes incubated for 72 hours in the presence or absence of 13-cis RA. Data represent the mean ± SEM of the fold change in gene expression as determined by QPCR in 8 samples compared to array analysis performed in 3 samples. QPCR results were analyzed by REST-XL software program and *P < 0.05 was considered significant. IGFBP3, insulin-like growth factor–binding protein 3; GATA3, GATA-binding protein 3; ZBTB16, zinc finger and BTB domain-containing 16.

