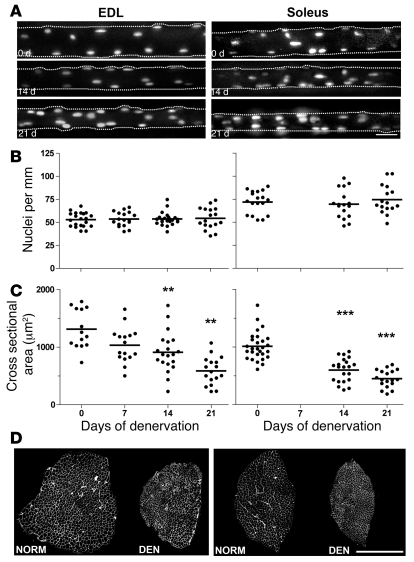
Figure 2. The effect of denervation on nuclei number and atrophy of single muscle fibers studied by acute in vivo staining and imaging in live animals.
Fluorescent oligonucleotides were injected into single fibers in the EDL (left panels) and soleus (right panels) muscles at 0–21 days after denervation. (A) Images of representative single muscle fibers. See legend of Figure 1 for details about image processing for the 2-dimensional illustrations. Scale bar: 25 μm. The number of nuclei (B) and the cross-sectional area (C) were calculated from the image stacks. Horizontal lines indicate means; asterisks indicate statistical differences from normal values (**P < 0.01; ***P < 0.001). (D) The degree of atrophy after 21 days of denervation is illustrated by laminin-stained cryosections in. Scale bar: 500 μm.

