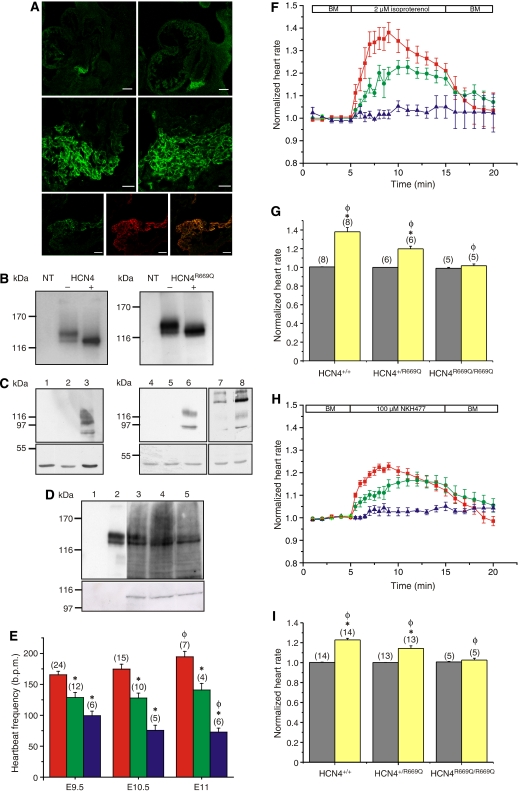
Figure 2.
The HCN4R669Q channel alters the embryonic heartbeat. (A) Upper panels: cryo-sections from HCN4+/+ (left) and HCN4R669Q/R669Q embryos (right) stained with an HCN4-specific antibody (PPc73K; bar: 100 μm). Middle panels: higher magnification of the labelled region (bar: 20 μm). Lower panels: Two independent HCN4-specific antibodies label identical structures in the heart of HCN4R669Q/R669Q embryos (left: PPc73K; middle: SHG-1E5; right: overlay; bar: 20 μm). (B) Western blot analysis of membrane proteins from Flp-In-293 cells, expressing HCN4 (left) or HCN4R669Q (right), labelled with the HCN4-β antibody. NT: non-transfected cells, +: treatment with PNGase F. (C) Left, upper panel: lysates from HEK293-mHCN1 cells. The following antibodies have been used to show the isoform specificity: 1, HCN4-β; 2, HCN4-specific PG2-7H9; 3, HCN1-specific RTQ-7C3. Middle, upper panel: lysates from HEK293-mHCN2 cells. Antibodies used: 4, HCN4-β; 5, HCN4-specific PG2-7H9; 6, HCN2-α. Right, upper panel: lysates from HEK293-mHCN4 cells. Antibodies used: 7, HCN4-β; 8, HCN4-specific PG2-7H9. All lower panels: loading control with anti-actin antibody. (D) Upper panel, lanes 1 and 2: membrane proteins from Flp-In-293 cells (1, non-transfected; 2, transfected with mHCN4) labelled with the HCN4-specific antibody PG2-7H9 (exposure time: 1 min). Lanes 3–5: total proteins from embryonic hearts (3, HCN4+/+; 4, HCN4+/R669Q; 5, HCN4R669Q/R669Q; 10 hearts per genotype) labelled with PG2-7H9 (exposure time: 10 min). Lower panel: loading control with anti-actinin antibody. (E) Basal embryonic heart rate at E9.5, E10.5, and E11 (HCN4+/+, red; HCN4+/R669Q, green; HCN4R669Q/R669Q, blue). The number of embryos analysed is indicated. Student's t-test: *P<0.05 compared to HCN4+/+ at the same developmental stage; φP<0.05 compared to the same genotype at E9.5. (F) Effect of isoproterenol (2 μM) on the embryonic heart rate (HCN4+/+, red; HCN4+/R669Q, green; HCN4R669Q/R669Q, blue). Data have been normalized to the rates during superfusion with BM. (G) Increase in heart rate (at 9 min) during perfusion with isoproterenol. Data have been normalized to the corresponding heart rate during superfusion with BM (grey, basal heart rate; yellow, heart rate at 9 min). Statistical analysis: student's t-test; *P<0.05 compared to basal heart rate; φP<0.05 compared to heart rate of the other genotypes at 9 min. (H) See F for NKH477 (100 μM). (I) See G for NKH477. Data represent mean±s.e.m.

