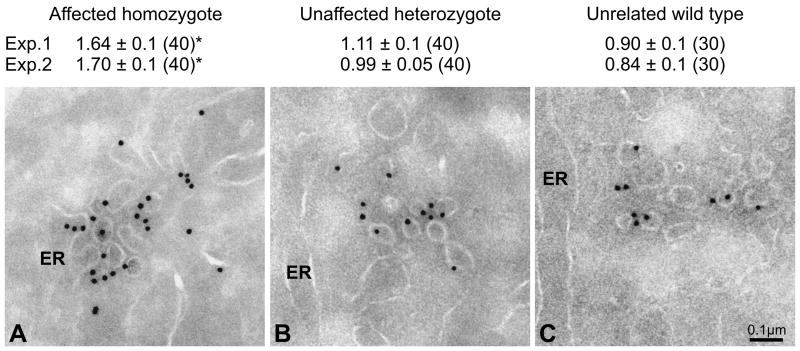
Figure 5. Sar1 is enriched at ER exit sites in CLSD patient cells.
Thin sections were analyzed by immuno-electron microscopy using anti-Sar1 antibody and gold labeled secondary antibody. The average number of gold particles per tubular-vesicular profile is given with standard errors. The number of images evaluated is in parentheses. * p<0.001 for homozygote versus heterozygote and unrelated wild type (Student t-Test).

