Figure 4.
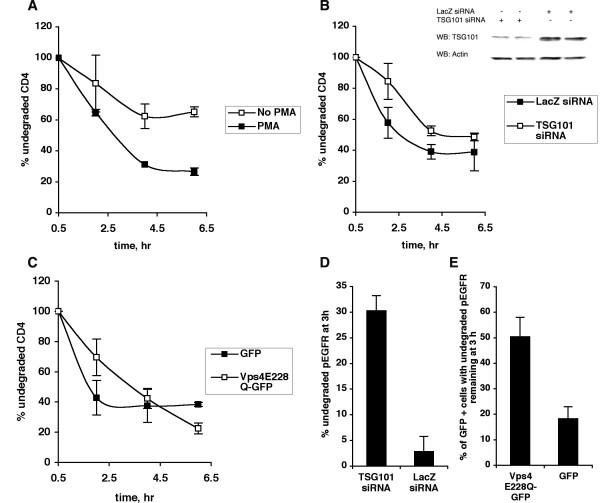
PMA-induced CD4 downregulation is TSG101 and Vps4 independent. (A) COS-1 cells transfected with CD4 were labeled with trans-35S-label for 10 minutes, then chased in non-radioactive medium in the presence or absence of 50 ng/ml PMA for the indicated times. At each time point, cells were lysed and radioactive CD4 was analyzed by immunoprecipitation, SDS-PAGE and phosphorimaging. The amount of CD4 remaining at each time point was determined as a percent of the amount of CD4 at the first chase time point, ie 0.5 hours. Data from one representative experiment (out of three) is shown. Error bars represent standard deviation between duplicates for each condition at each time point. (B) COS-1 cells co-transfected with CD4 and siRNA against TSG101 or LacZ were treated as described in (A). Data from one representative experiment (out of four) is shown. Also shown is an immunoblot of TSG101 and actin levels in COS-1 cells co-transfected with CD4 and siRNA directed against either TSG101 or LacZ. (C) COS-1 cells co-expressing CD4 and either GFP or Vps4E228Q-GFP were treated as described in (A). Data from one representative experiment (out of three) is shown. (D) COS-1 cells were transfected with siRNA directed against either TSG101 or LacZ, serum-starved, and treated with 50 ng/ml EGF for 10 min. The cells were then washed, reincubated with fresh media for 0 or 3 hours, lysed and analysed by SDS-PAGE and Western blotting with an anti-pEGFR antibody. The percent of undegraded pEGFR remaining at 3 hour was determined for the two conditions. Error bars represent SD between duplicates for each condition. (E) COS-1 cells were transfected with GFP or Vps4E228Q-GFP, serum-starved, and allowed to internalize EGF for 10 min. The cells were then washed, reincubated with fresh media for 3 hours and analysed for GFP fluorescence, or endogenous phosphoEGFR by immunofluorescence. The percentage of GFP positive cells with pEGFR remaining at 3 hours was determined for the two conditions. Error bars represent SD between duplicates for each condition.

