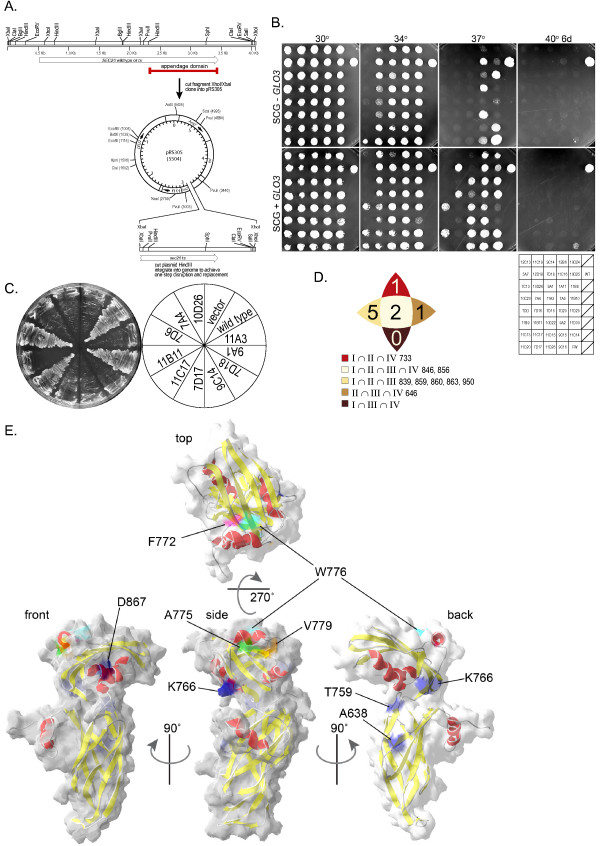
Figure 4.
Phenotype of sec26ts Mutants. A. Schematic of strategy to create appendage domain mutants for suppressor screening. ts alleles created as described in Materials and Methods were subcloned into the vector pRS305 for one-step gene disruption and replacement to create integrated genomic sec26 alleles. B. The sec26Δ tester strain was transformed with each of the sec26ts mutant plasmids and plated on synthetic complete media (SCD) with 5-FOA to counter-select for the wild type SEC26 plasmid (not shown). The resultant strains were plated at 30, 34, 37, and 40°C to demonstrate the temperature sensitive phenotype of each mutant (top row). Each strain was transformed with a GLO3 expressing plasmid under control of the galactose-inducible promoter (PGAL1/10) and plated on SCG at the above listed temperatures to evaluate the ability of GLO3 to suppress the ts phenotype (bottom row). The data is also summarized in Table 1. C. The sec26Δglo3Δ tester strain was transformed with each of the sec26ts mutant plasmids and streaked onto SCD + 5-FOA to assess growth when sec26ts was expressed as the only copy of SEC26 in the glo3Δ background. One representative plate is shown. Data for all sec26 alleles is summarized in Table 1. D. Diagram showing the numbers of residues identified at the intersection of at least three of the Groups I-IV together with the residue number in Sec26p. E. Mapping of residues identified in Figure 4D onto the known structure of γCOP appendage domain. The γCOP appendage structure is depicted as a ribbon diagram with α-helices in red and β-strands in yellow. The calculated molecular surface (transparent grey) is overlaid on the ribbon diagrams. Selected residues (K766, T759, A638, D867) were identified from the alignment shown in Figure 1 as the equivalent of the Sec26p residues chosen as described in Figure 4D and shown in blue. For clarity, the residues surrounding and including the FxxxW motif are shown in additional colors: pink (F772), light blue (W776), green (A775), and orange (V779). The appendage is shown from a "side" view (center image) with the NH2-terminal α-helix projecting toward the viewer. The image was then rotated 90° for the "front" view (left image), 90° for the "back" view (right image), and 90° towards the viewer for the "top" view (top image). Each of the selected residues has surface exposure.

