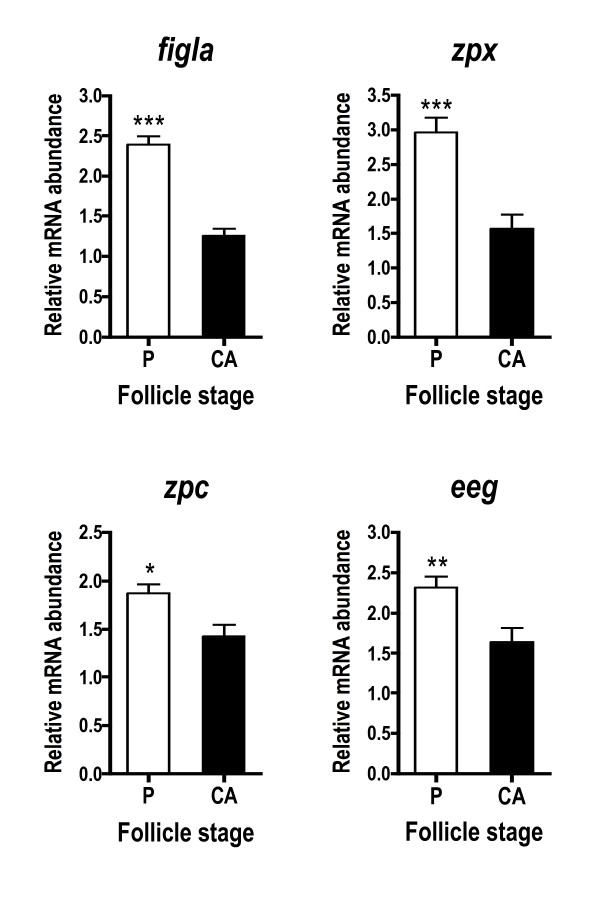
Figure 2.
Abundance of zona pellucida glycoprotein-related transcripts during primary and early secondary oocyte growth in salmon. Open bars denote perinucleolus (P) stage samples, while solid bars denote cortical alveolus (CA) stage samples. Each bar represents the mean + SEM of 10 fish per stage with *P < 0.05, **P < 0.01 and ***P < 0.001 indicating statistical differences. Relative transcript levels were normalized to ef1a.

