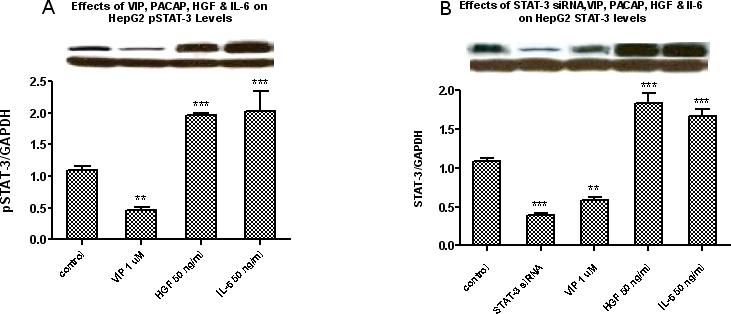
Figures 5A and 5B.

Western blot analysis for pSTAT-3 protein levels at 6 hours (Figure 5A) and STAT-3 levels at 72 hours (Figure 5B) shows that VIP at 10−6M decreased HepG2 pSTAT-3 and STAT-3 protein expressions; in contrast, HGF (50 ng/ml) and IL-6 (50 ng/ml) increased the protein expression of both pSTAT-3 and STAT-3. In addition, transfecting the cells with STAT-3 siRNA for 72 hours also significantly inhibited STAT-3 levels. Bars represent the quantitative analysis of the relative band intensities of STAT-3 and pSTAT-3 versus GAPDH. Figure 5A: Data is expressed as the mean ± SEM; for pSTAT-3 at 6 hours, N = 3 and ***ρ< 0.001 for HGF and IL-6, and **ρ< 0.01 for VIP versus untreated cells. Similarly, as shown in Figure 5B, VIP at 10−6M and STAT-3 siRNA at 40 pmol/ml significantly reduced HepG2 STAT-3 protein levels while HGF and IL-6 at 50 ng/ml increased them. Data is expressed as the mean ± SEM, N = 4 and ***ρ< 0.001 for STAT-3 siRNA, HGF and IL-6 and **ρ< 0.01 for VIP versus untreated cells.
