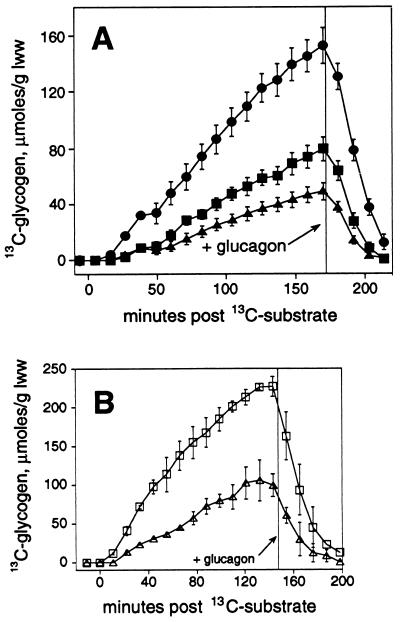
Figure 3.
Quantitation of the effects of leptin treatment on kinetics of glycogen synthesis in ob/ob mouse liver (A) and lean mouse liver (B). 13C enrichments in the glucosyl units (μmol/glww) are shown over time after initial addition of [2-13C]pyruvate and NH4Cl. For ob/ob mouse liver (A), the effects of leptin treatment in vivo (•) (n = 7) or in vitro (▪) (n = 5) are compared with control (▴) (n = 9). For lean mouse liver (B), the effect of leptin treatment in vitro (□) is compared with control (▵), n = 2–3 each. Where not visible, error bar is smaller than symbol.

