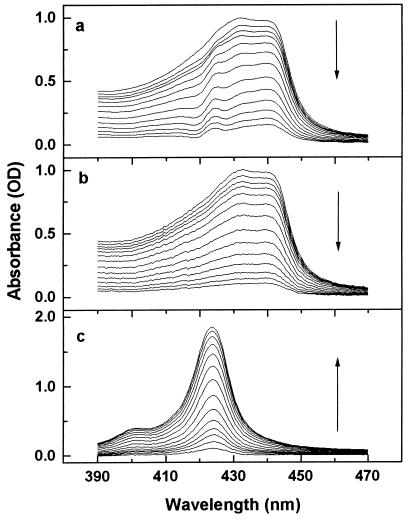
Figure 3.
(a) “Best difference spectra” between the spectra in Fig. 1 and MbCO spectra measured under identical conditions without prior photolysis. For details, see the text. (b) Mb*CO spectra separated from the composite spectra in Fig. 1 by following the procedure described in the text. (c) Evolution of the MbCO spectra after separation. The arrows mark the direction of the spectral evolution with increasing temperature.

