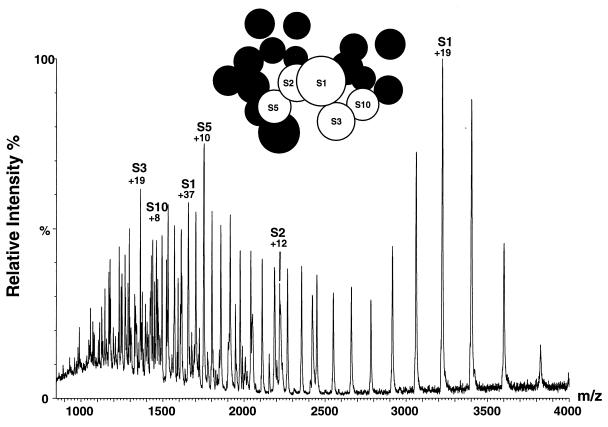
Figure 2.
Positive ion ESI mass spectra of aqueous solutions of 30S subunits at pH 6.4. Ninety-five percent of the peaks observed in this spectrum have been assigned to various charge states of the five 30S proteins indicated; only the most intense peak of the charge-state distribution for each protein is labeled (along with the total charge for that particular peak). (Inset) Representation of the topology of the 30S E. coli ribosomal subunit, derived from neutron scattering measurements of partially deuterated ribosomes (20). Proteins observed in the mass spectrometer are shown in labeled, white circles; unobserved proteins are represented as unlabeled, black circles.

