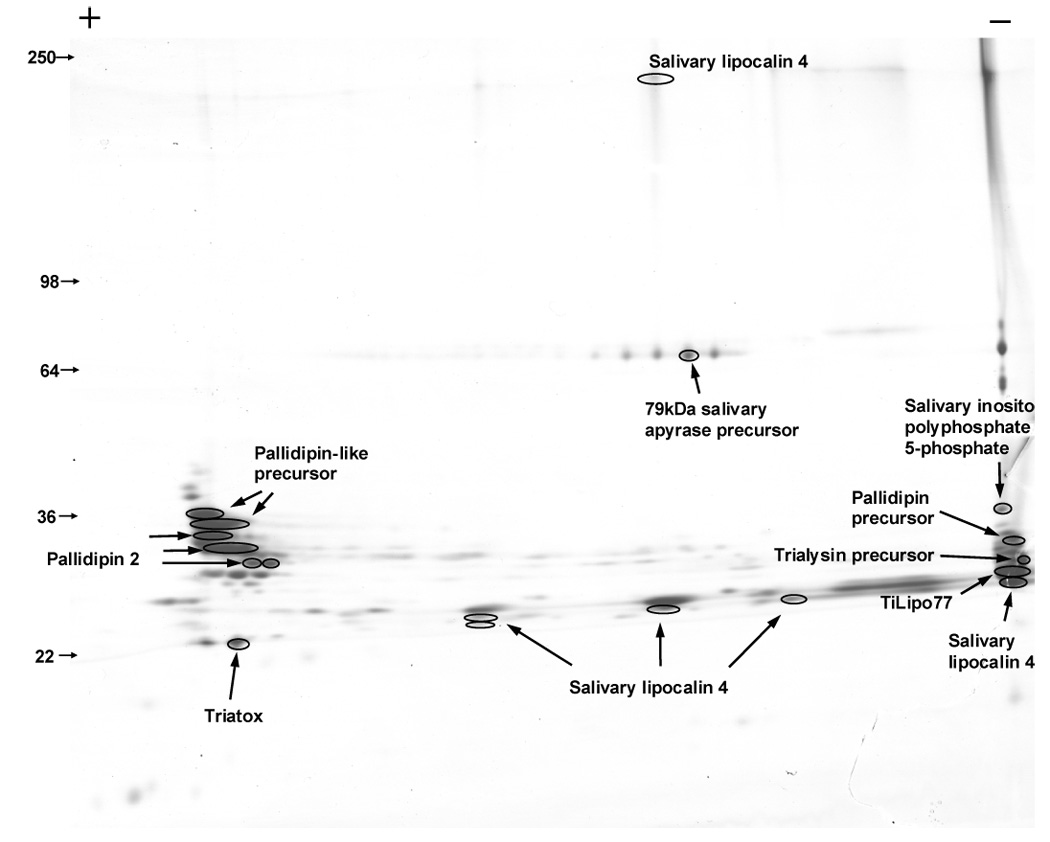
Figure 12.

Two-dimensional (2D)-gel electrophoresis of Triatoma infestans salivary proteins. Numbers on the left indicate molecular weight marker positions in the gel. The + and − signs indicate the anode or cathode side of the isoelectrophocusing dimension, which ranged from pH 3–10. Gel bands that were identified to a protein (following tryptic digestion and mass spectrometry) are shown in the gel. In some cases, more than one band accounted for the same protein, possibly due to trailing or multiple isoforms. For experimental details, see Materials and methods.
