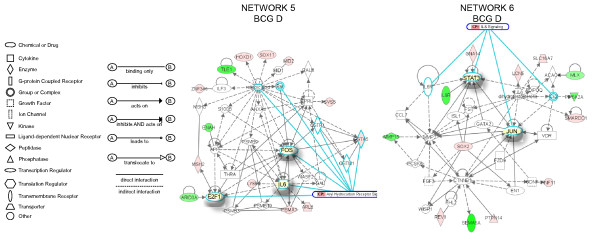
Figure 4.
Networks 5 and 6. BCG-induced specific genes in the detrusor muscle. Microarray results were normalized by a robust regression analysis and only genes with an expression above a conditional threshold of 0.001 (3 SD above background) were selected for analysis. Next, genes presenting a 3-fold ratio in regard to the control group were entered as focus genes in Ingenuity Pathway Analysis (IPA) for a core analysis which put the datasets in the context of biological processes, pathways, and molecular networks.

