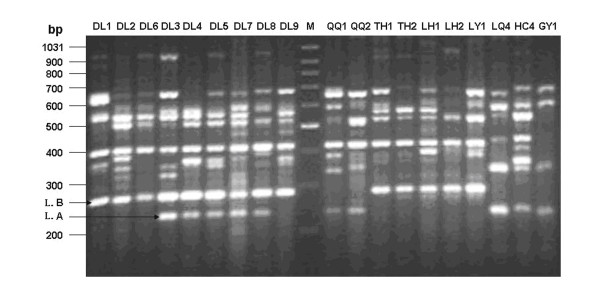
Figure 6.
Amplified patterns generated by using ISSR primer UBC826. Letters and numbers above the figure are codes for individuals from different localities (letters are abbreviations same to Table 1, numbers are corresponding to individuals). "M" represents the molecular marker of 100-bp ladder, with fragment length of each band indicated. L. A and L. B are bands unique to lineage A and lineage B, respectively.

