Figure 2.

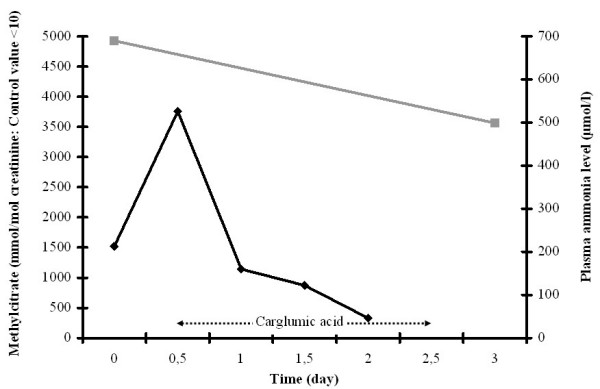
Plasma ammonia levels (black lines) and toxic metabolite excretions (grey lines) during the course of treatment: patient 2 with propionic aciduria (PA).

Plasma ammonia levels (black lines) and toxic metabolite excretions (grey lines) during the course of treatment: patient 2 with propionic aciduria (PA).