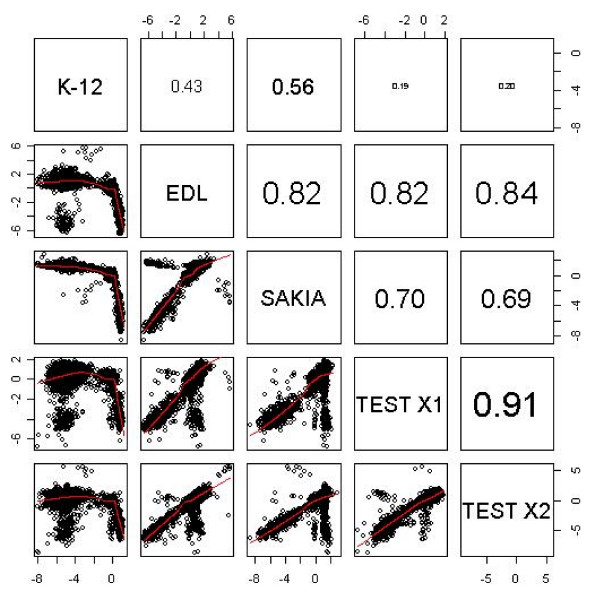
Figure 4.
A scatter plot matrix of unknown test strains. A scatter plot matrix of the three reference and two test strains (X1, and X2 represent strains 0864/00 and 0330/01) were compared to identify test strains most similar to each sequenced strain. The lower left panes present the scatter plots with smoothing splines and the right hand panel displays the Pearson's correlation coefficient.

