
Figure 2.
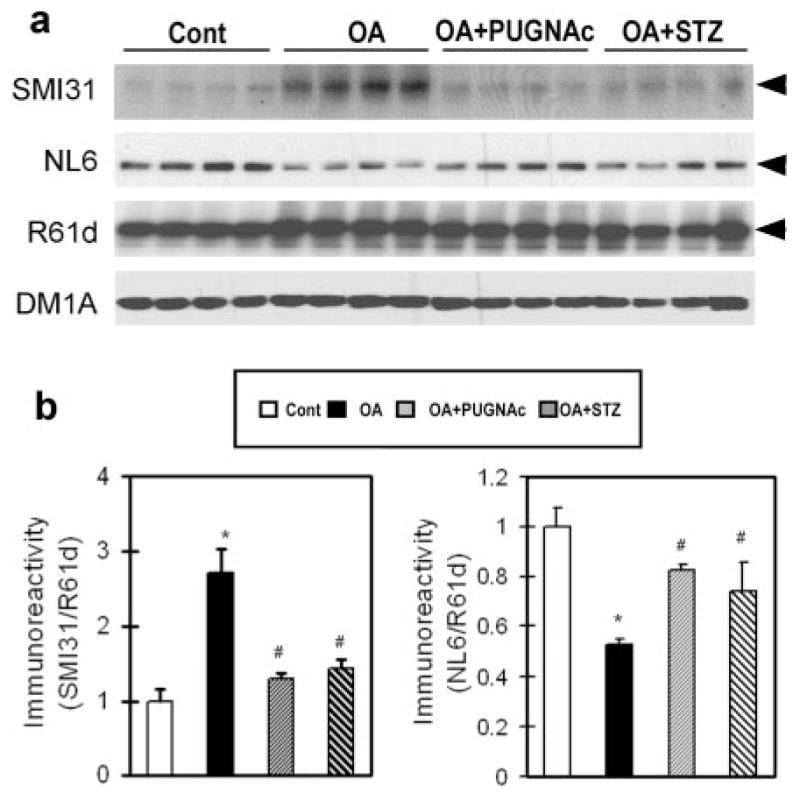
Effect of O-GlcNAcylation on OA-induced phos-phorylation of NF-M in SH-SY5Y cells. a) Cells were treated with either 0.1 μM OA alone or together with 20 μM PUGNAc or 10 μM STZ for 3 h, followed by Western blot analysis of the levels of phosphorylation and O-GlcNAcylation of NF-M with antibodies SMI31 and NL6, respectively. Blots developed with antibody R61d to total NFs and DM1A to α-tubulin were included as loading controls. Arrowheads indicate the 160 kDa NF-M band. Each lane was from an individual treatment. b) The phosphorylation and O-GlcNAcylation levels of NF-M of blots shown in a were densitometrically quantitated after being normalized with the total NF-M level of R61d blot. Data are presented as mean ± SE. *P < 0.05 vs. control group. #P < 0.05 vs. OA-treated group.