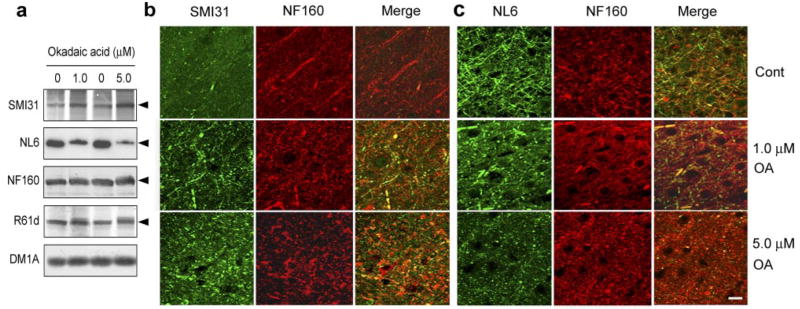
Figure 3.
OA induces increased phosphorylation and decreased O-GlcNAcylation of NF-M in rat brain slices. Metabolically active rat brain slices were incubated with artificial cerebrospinal fluid containing 0, 1.0, or 5.0 μM OA for 3 h, followed by analysis of phosphorylation (by SMI31), O-GlcNAcylation (by NL6), and the total level (by NF160 and R61d) of NF-M by Western blots (a) and by double immunofluorescence staining with SMI31/NF160 (b) and NL6/NF160 (c). In a, blot with DM1A against α-tubulin was included as a loading control, and the arrowheads indicate the NF-M band. b, c) Show the cerebral cortex of the rat brain slices. Scale bar = 20 μm.

