
FIGURE 3.
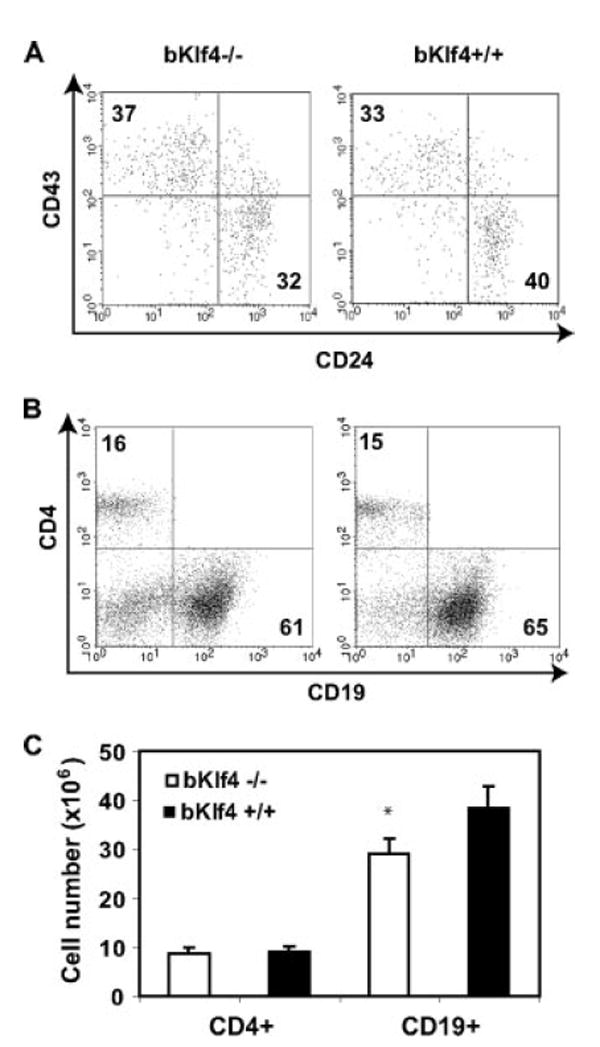
Modest loss of pre-B cells and mature B cells is observed in bKlf4−/− mice. A, Decrease of pre-B, but not pro-B, cells in bone marrow of bKlf4−/− mice. A representative dot plot of CD43 and CD24 staining of B220+ bone marrow cells from bKlf4−/− and bKlf4+/+ mice. The numbers indicate the mean percentage of cells. B, Decrease of mature B cells in spleen of bKlf4−/− mice. A representative dot plot of CD19 and CD4 staining of splenocytes from bKlf4−/− and bKlf4+/+ mice. C, Reduction of number (25%) of mature B cells but not CD4 T cells in spleen in bKlf4−/− mice. Data were presented as mean ± SEM (n = 12); *, p < 0.05.