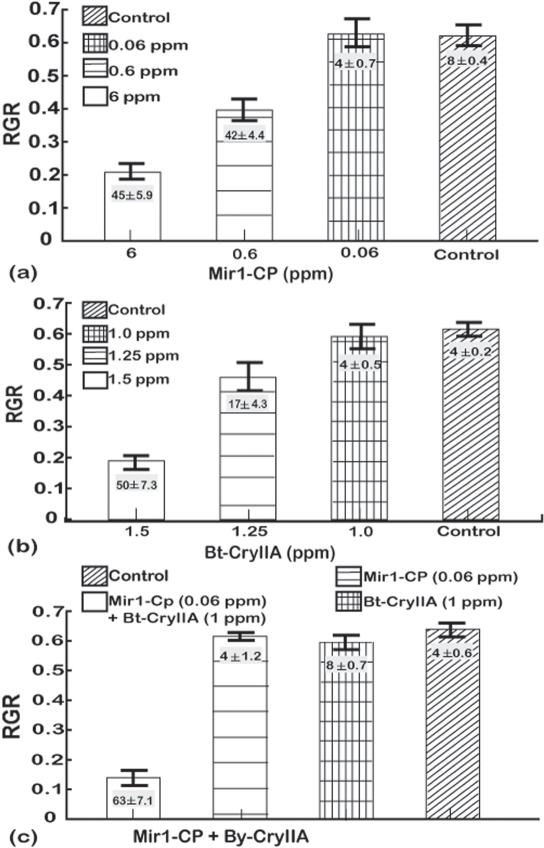
Figure 4. Dose response analysis for southwestern corn borer larvae fed (a) Mir1-CP, (b) Bt-CryIIA, and (c) sub-lethal doses of Bt-CryIIA and Mir1-CP.
The y-axis is the relative growth rate (RGR measured as Δmg/(mgavgd) and vertical bars indicate one standard deviation. The least significant difference (LSD) at the 0.05 confidence level for the RGR values were as follows: Mir1-CP – 0.15, Bt-CryIIA – 0.23, sub-lethal doses of Bt-CryIIA and Mir1-CP combinded – 0.38. Numbers (mean±SD) in the histogram bars are the average percentage mortality for each treatment. The least significant difference (LSD) at the 0.05 confidence level for mortality were as follows: Mir1-CP – 8.97, Bt-CryIIA – 9.24, sub-lethal doses of Bt-CryIIA and Mir1-CP combined – 16.88. Results are based on four independent bioassays. Concentrations are given as parts per million (ppm).

