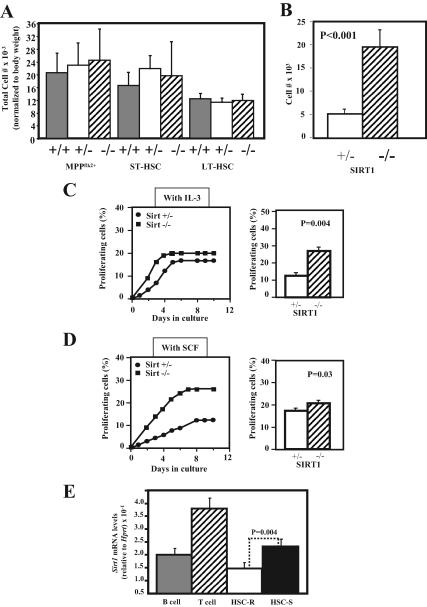
Figure 4.
Analysis of the effect of Sirt1 deficiency on HSCs and progenitor frequency and proliferation. (A) Analysis of the affect of Sirt1 deficiency on HSCs and progenitor numbers. Bone marrow was harvested, red blood cells were lysed, and the remaining white cells were stained with fluorophor-conjugated antibodies to markers for HSCs and progenitors (see Materials and Methods for details). Multipotent progenitors and short-term and long-term HSCs are defined as the c-Kit+Sca-1+LinnegFlk2+CD34+ fraction, the c-Kit+Sca-1+Linneg Flk2negCD34+ fraction, and the c-Kit+Sca-1+LinnegFlk2negCD34neg fraction of WBM, respectively. The average total cell number for each type of cell, normalized to body weight, is shown (for each bar, n ≥ 3). Error bars, SD. (B) Quantitative analysis of cell numbers after 1 wk of growth in complete media. BM was stained as described in Materials and Methods, and 100 HSCs were sorted directly into individual wells of a 48-well plate containing complete media. Bars represent average counts from five wells. HSCs are defined as the c-Kit+Sca-1+SLAM(CD150)+LinnegFlk2neg fraction of WBM. (C) Left, graph represents read out over time of Terasaki plates containing single HSCs per well. The HSCs were sorted into Terasaki plates containing serum free X-Vivo media plus IL-3, and plates were monitored daily for the number of wells containing proliferating cells (i.e., more than one cell). Right, graph represents average value of frequency of proliferating HSCs from four Terasaki plates. HSCs are defined as the c-Kit+Sca-1+SLAM(CD150)+LinnegFlk2neg fraction of WBM. For all experiments, mice were 3–9 wk old. p values represent results from Student's t test. (D) Same experiments as in C were performed except that cells were sorted into media containing Steel factor. (E) Analysis of Sirt1 mRNA levels in resting and proliferating HSCs. HSCs (n = 1000) were purified from young adult mice (n = 3), and RNA was either extracted immediately for analysis of resting HSCs (HSC-R) or cells were stimulated to proliferate in media (X-Vivo15 serum-free media [Stem Cell] plus 20 ng/ml Steel factor, 10 ng/ml IL-6, 30 ng/μl IL-3, 2 mM l-Glu, and 50 μM mercaptoethanol) for 5 d for analysis of proliferating HSCs (HSC-S). Both T-cells (CD-3+B220negMac1neg) and B-cells (B220+CD-3negMac1neg) were purified from the bone marrow as a reference. RNA was extracted using Trizol, cDNA was synthesized using Superscript III (Invitrogen), and real-time PCR was performed using primers specific for Hprt (reference) and Sirt1 yielding single amplicons of 100 and 150 bp, respectively. Forty cycles of PCR was performed in triplicate for all samples using an iCycler real-time PCR machine (Bio-Rad). For each cell type, the average level of Sirt1 is shown, relative to Hprt.

