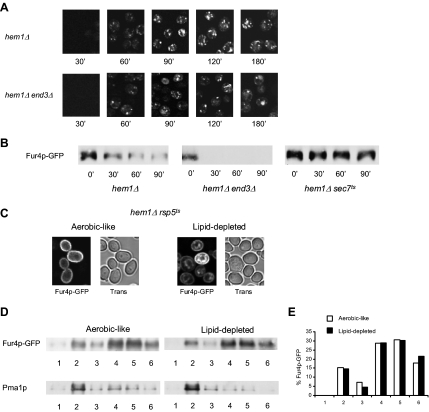
Figure 3.
Characteristics of Fur4p-GFP trafficking under lipid depletion. (A) hem1Δ [pFl38gF-GFP] and hem1Δ end3Δ [pFl38gF-GFP] cells were cultivated exactly as in Figure 2B before visualization of GFP fluorescence. (B) hem1Δ [pFl38gF-GFP], hem1Δ sec7ts [pFl38gF-GFP], and hem1 end3Δ [pFl38gF-GFP] cells were grown for 7 h at 23°C under lipid depletion before transfer at 37°C and induction of Fur4p-GFP synthesis. After 2 h under these conditions, cycloheximide was added to the medium at a final concentration of 100 μg ml−1 (t 0′). Total proteins were extracted from cells at the time indicated and the same amounts of protein were subjected to SDS-PAGE and Western blot analysis by using an anti-GFP antibody. (C) hem1Δ rsp5ts [pFl38gF-GFP] cells were grown in YPGal + ALA (aerobic-like) or YPGal (lipid-depleted) at 28°C for 24 h before visualization of GFP fluorescence by confocal microscopy. Trans, transmission. (D) hem1Δ sec7ts [pFl38gF-GFP] were grown under aerobic-like or lipid-depleted conditions for 7 h as indicated before induction of Fur4p-GFP synthesis. After 2 h after induction, cell lysates were subjected to Triton X-100 extraction and OptiPrep density gradient centrifugation. Six fractions were collected from the top of the gradient, TCA-precipitated, and analyzed by Western blot with anti-GFP and anti-Pma1p antibodies. (E) Fur4p-GFP signal in the fractions of the OptiPrep density gradient displayed in (D) has been quantified using the Scion Image software.

