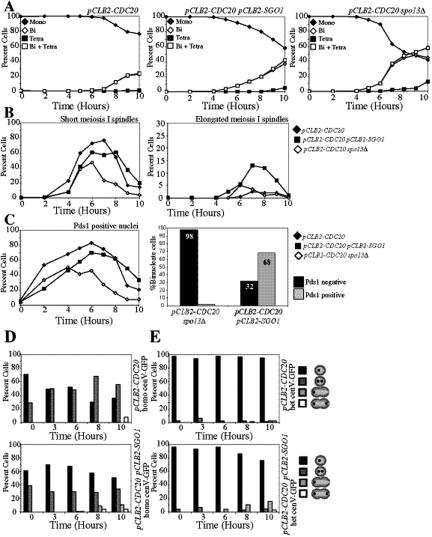
Figure 3.
Sgo1 depletion allows for spindle elongation despite APC inactivation. (A–C) Diploid pCLB2-CDC20 (A5823), pCLB2-CDC20 pCLB2-SGO1 (A15190), and pCLB2-CDC20 spo13Δ (A8683) strains each carrying a PDS1–18MYC fusion were sporulated. (A) The percentage of mononucleate (♦), binucleate (◇), and tetranucleate (■) as well as the sum of binucleate and tetranucleate (□) was determined at the indicated time points for pCLB2-CDC20 (left), pCLB2-CDC20 pCLB2-SGO1 (middle), and pCLB2-CDC20 spo13Δ (right) strains. (B) Metaphase I spindles (left) and anaphase I spindles (right) were counted for pCLB2-CDC20 (♦), pCLB2-CDC20 pCLB2-SGO1 (■), and pCLB2-CDC20 spo13Δ (◇) strains. (C) The number of Pds1-positive and -negative cells for pCLB2-CDC20 (♦), pCLB2-CDC20 pCLB2-SGO1 (■), and pCLB2-CDC20 spo13Δ (◇) strains was determined at the indicated times (left). The percentages of Pds1-positive and -negative binucleate cells are shown (right). (D and E) Diploid pCLB2-CDC20 and pCLB2-CDC20 pCLB2-SGO1 strains were sporulated, and the percentage of mononucleate cells with one dot (black) and two dots (dark gray) as well as binucleate cells with one dot (light gray) and two dots (white) was counted. (D) pCLB2-CDC20 (A15163) and pCLB2-CDC20 pCLB2-SGO1 (A17839) strains with homozygous CENV GFP dots are shown. (E) pCLB2-CDC20 (A7118) and pCLB2-CDC20 pCLB2-SGO1 (A17838) strains with heterozygous CENV GFP dots are shown.

