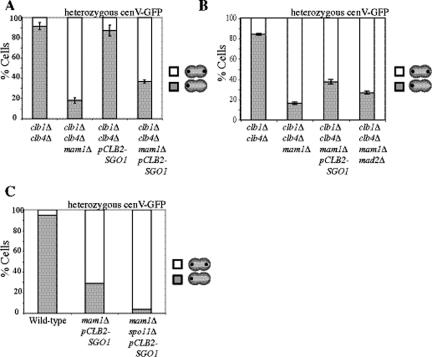
Figure 7.
Sgo1 helps bias sister chromatids toward biorientation. (A) clb1Δ clb4Δ (A11953), clb1Δ clb4Δ mam1Δ (A17314), clb1Δ clb4Δ pCLB2-SGO1 (A17615), and clb1Δ clb4Δ mam1Δ pCLB2-SGO1 (A17616) with heterozygous CENV GFP dots were sporulated. Binucleate cells were counted for wild-type and clb1Δ clb4Δ strains heterozygous GFP dots from the same time course shown in Figure 5A. The number of cells with one dot in one nucleus (▩) and the percentage of cells with dots in both nuclei (□) were counted. Shown is the average of three experiments (n = 100); error bars, SDs. (B) clb1Δ clb4Δ (A11953), clb1Δ clb4Δ mam1Δ (A17314), clb1Δ clb4Δ mam1Δ pCLB2-SGO1 (A17616), and clb1Δ clb4Δ mam1Δ mad2Δ (A18712), with heterozygous CENV GFP dots were sporulated. The number of cells with one dot in one nucleus (▩) and the percentage of cells with dots in both nuclei (□) were counted. Shown is the average of three experiments (n = 100); error bars, SDs. (C) Wild-type (A5811), mam1Δ pCLB2-SGO1 (A11252), and mam1Δ spo11Δ pCLB2-SGO1 (A18229) strains with heterozygous CENV GFP dots were sporulated. Shown is the percentage of binucleate cells with one dot in one nucleus (▩) and with dots in both nuclei (□). One hundred cells were counted for each strain from cells after 6 h of sporulation.

