Figure 2.
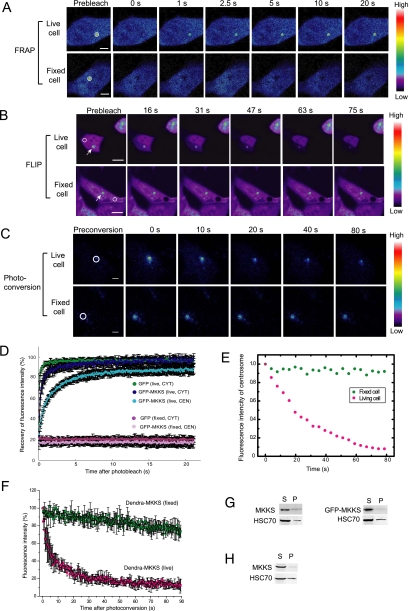
Wild-type MKKS highly concentrated in the centrosome rapidly shuttles to and from the cytosol. (A) FRAP analysis of MKKS at the centrosome. GFP-MKKS at centrosomes, as indicated by circles, was bleached for 10 ms, and its subsequent movement from the cytosol was monitored. Bar, 5 μm. (B) FLIP experiment was performed by continuous bleaching of a small area (circles) in the cytosol. Bar, 10 μm. (C) Dendra-MKKS at the centrosome was photoconverted from green to red, and movement of the red color emission after the conversion was monitored. Bar, 5 μm. (D) Quantification of the fluorescence intensity of GFP-MKKS during the FRAP experiments (n = 20). CYT and CEN denote cytosol and centrosome, respectively. (E) Fluorescence intensity at centrosomes during FLIP analysis shown in B. (F) Red fluorescence intensity of Dendra-MKKS at the centrosome after photoconversion (n=3) (G and H) MKKS solubility test employing centrifugal fractionation. Transiently expressed untagged MKKS or GFP-MKKS (G) or untagged MKKS expressed in a stable cell line (H) were analyzed by centrifugal fractionation followed by Western blotting by using the MKF-1 anti-MKKS antibody. S, supernatant; P, pellet.

