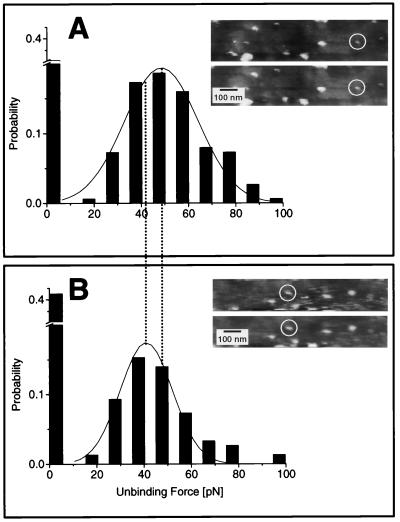
Figure 4.
Histograms of the unbinding forces of a wild-type (A) and a mutant (B) scFv. Each histogram comprises 3 × 50 force–distance curves of the same molecule. The interval width in the histograms is 10 pN and the unbinding forces Fu were determined by a Gaussian fit. All data shown were obtained with the identical cantilever. (Insets) The images next to the histograms show the selected binding protein before and after the measurement.

