Figure 4.

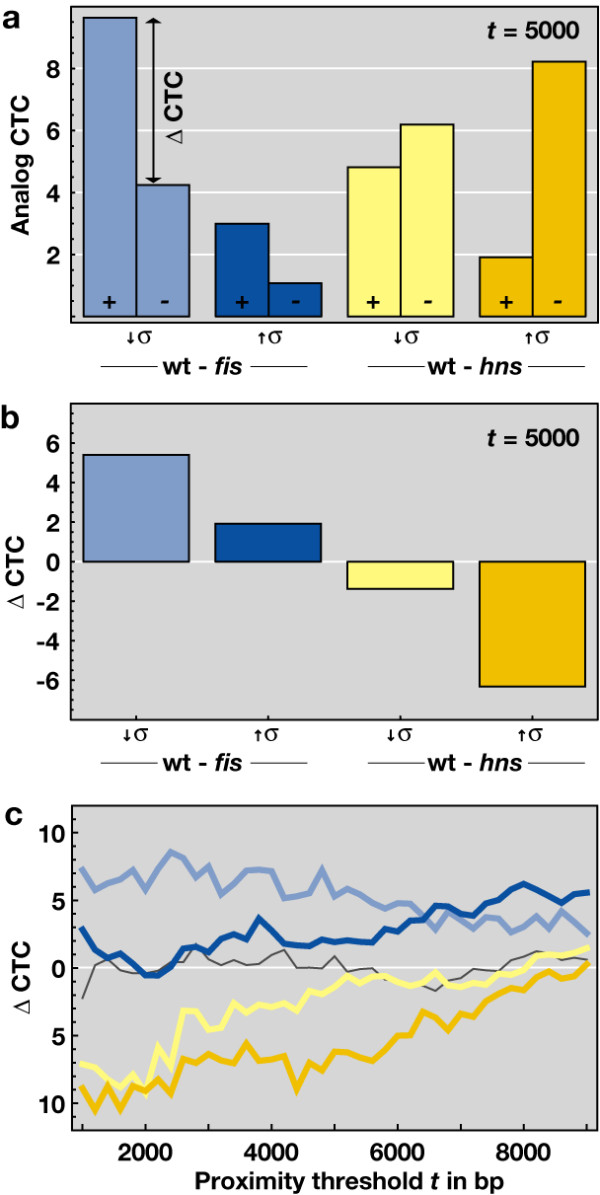
Analog control-type confidence of gene proximity networks. (a) Analog CTC of the four inter-strain expression profiles at proximity threshold t = 5 kb. The left (+) and right (-) bars correspond to expression data with log-ratios above and below 0, respectively. A positive log ratio (+) is associated with either a raised expression in wild type, or a inhibited expression in the mutant strain. (b) Difference (left bar – right bar) of the analog CTCs from (a) for each inter-strain experiment at t = 5 kb. (c) Difference of the CTCs for each inter-strain experiment against the proximity threshold t. For t > 10 kb, the effective GPNs are almost fully connected and a proper CTC calculation fails. Note that fis (blue) has a preponderantly activating and hns (yellow) a preponderantly repressing regulatory effect. As expected, the wild type intra-strain experiment does not deviate strongly form the random null model (dark gray) and results in ΔCTC ≈ 0.
