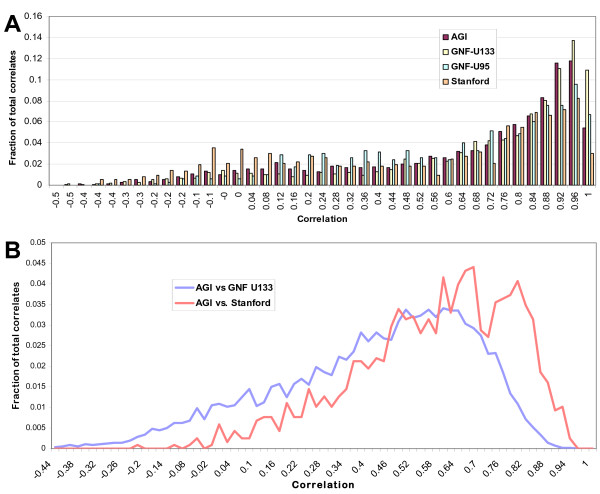
Figure 1.
Replication of gene expression studies. A) Distribution of correlations between duplicates within studies. Array spots containing duplicate genes (identical Unigene ID's) within the different microarray assays were compared by Pearson correlations. The four array experiments shown have comparable levels of reproducibility. For the AGI expression data, over half of duplicated array spots showed a Pearson correlation of 0.8 or greater, and over 93% of duplicates had a positive correlation. B) Distribution of correlations between duplicates between studies. Array spots containing duplicate genes between the different microarray assays were compared by Pearson correlations. The expression measurements showed 99% of duplicate genes have a positive correlation between the AGI arrays and the similarly spotted-cDNA Stanford arrays between their patterns of expression across the cell lines. Comparison to the GNF U133 printed array study showed 93% of duplicated genes have a positive correlation.

