
Fig. 5.
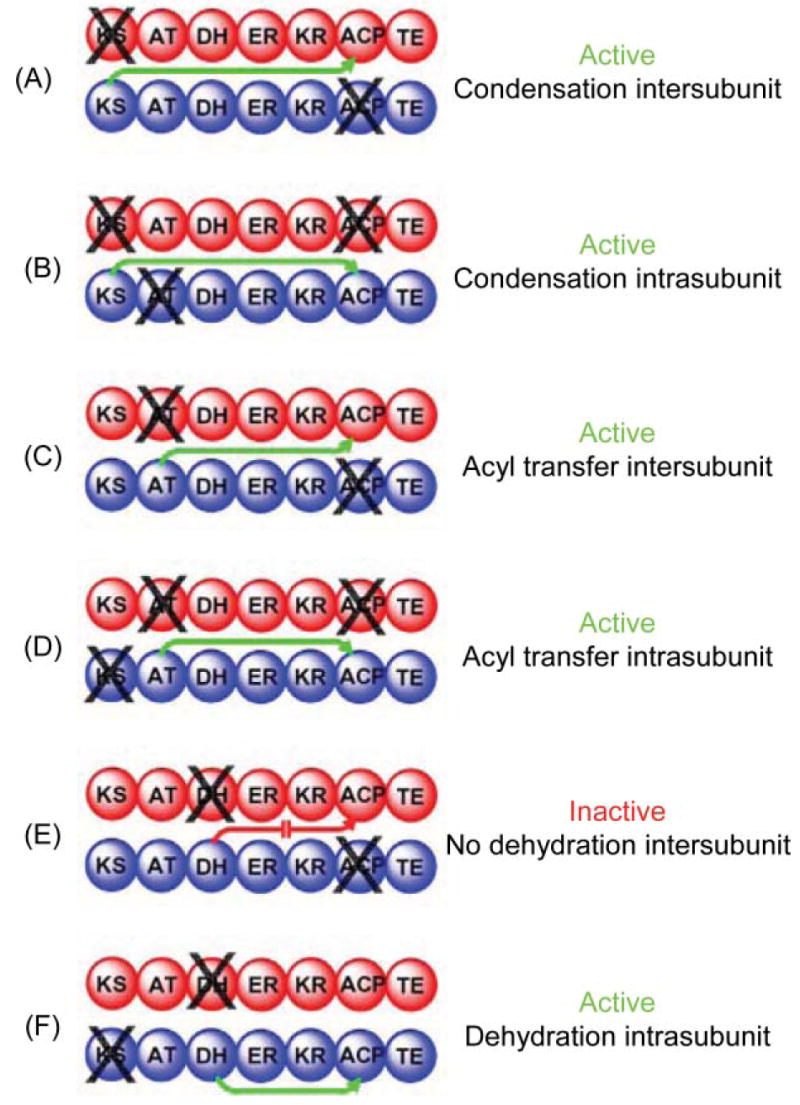
Mapping domain interactions in the FAS by mutant complementation analysis. The two individually mutated FAS subunits forming each heterodimer are colored red and blue and the site of the knockout mutation is indicated by X. Green arrows indicate which catalytic domains engage in functional interactions with an ACP domain. A red arrow indicates the blocked interaction responsible for an inactive heterodimer.