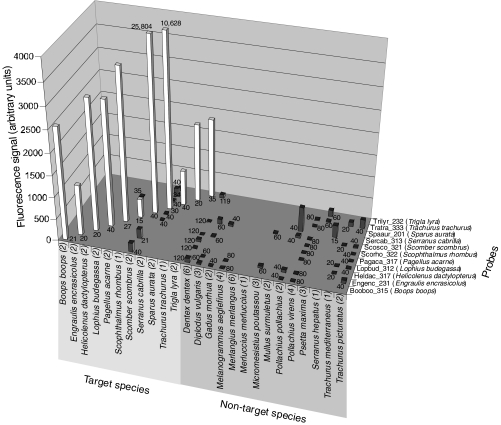
Figure 4.
Signals (background subtracted from absolute signal) of single target and nontarget hybridisations. White bars represent true-positive signals; false-positive signals are shown as grey bars. Numbers at the basis of the bars indicate the amount of measured spots. The number of hybridisations is given in brackets after target and nontarget names. Replication and absolute signal intensities (± standard deviation) of hybridized targets to the corresponding probe are given in Table 4.

