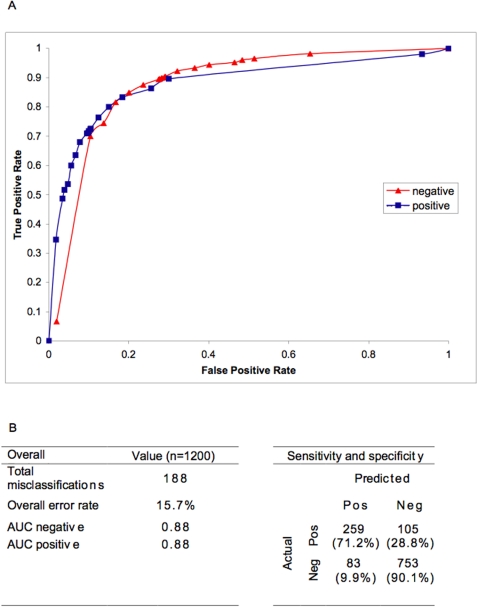
Figure 2. Performance of the decision algorithm for dengue diagnosis.
A. Receiver operating characteristics (ROC) curve for the diagnostic algorithm in predicting dengue positive and dengue negative cases. B. Summary of K-fold (k = 10) cross-validation analysis for the dengue diagnostic algorithm with 2×2 analysis for the algorithm's sensitivity and specificity in dengue diagnosis.

