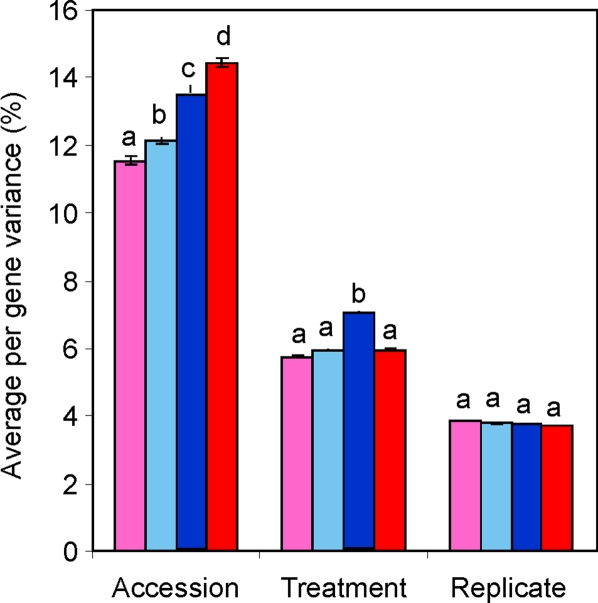
Figure 2. Partitioning of transcript variance in a factorial analysis of genetic and abiotic variation.
Individual transcripts' variance components were partitioned via ANOVA within a replicated factorial experiment comparing natural genetic variation with an abiotic stress treatment. The average percent of total variation per individual transcript is shown for unique genes (pink), the whole genome average (light blue), segmental duplicated genes (dark blue) and tandem duplicated genes (red). Within a factor, letters show significantly different duplication classes.

