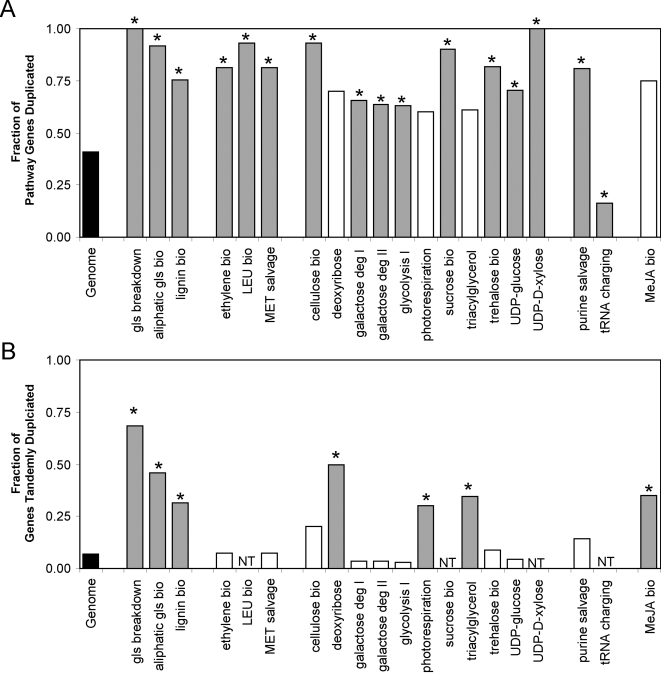
Figure 6. Biased frequency of gene duplication in metabolic pathways.
The level of gene duplication within metabolic pathways that show biased gene duplication frequency is presented. χ2 analysis was used to test duplication frequency within each metabolic pathway for deviation from the whole genome expectation. * and blue bars show pathways that have a statistically significant bias in gene duplication after adjusting for multiple comparisons at an FDR of 0.05. The bars are separated into biochemical groups (left to right: secondary metabolism, amino acid related, energy related, nucleotide related and hormone related). A. Total duplicated genes per metabolic pathway. B. Tandem duplicated genes per metabolic pathway.

