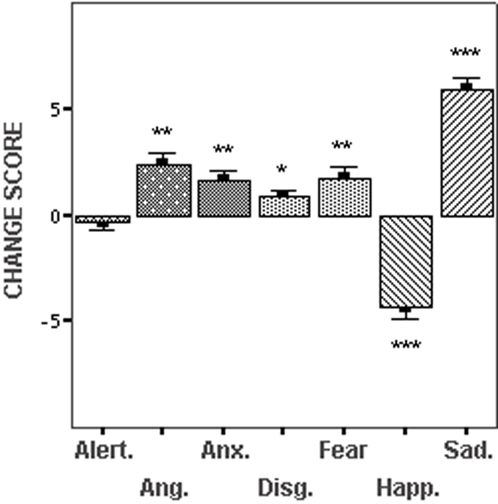
Figure 1. Subjective Mood State.
Relative mean change scores (possible range±0–10) and the standard error of the mean for seven self-report dimensions that were used to quantify subjects' mood state after the neutral and sad recall conditions. The magnitude of statistical differences for each dimension (assessed by paired samples t tests) is referenced by * = p<0.01; ** = p<0.001; *** = p<0.0001.

