
Figure 2. Common Resting-State Networks.
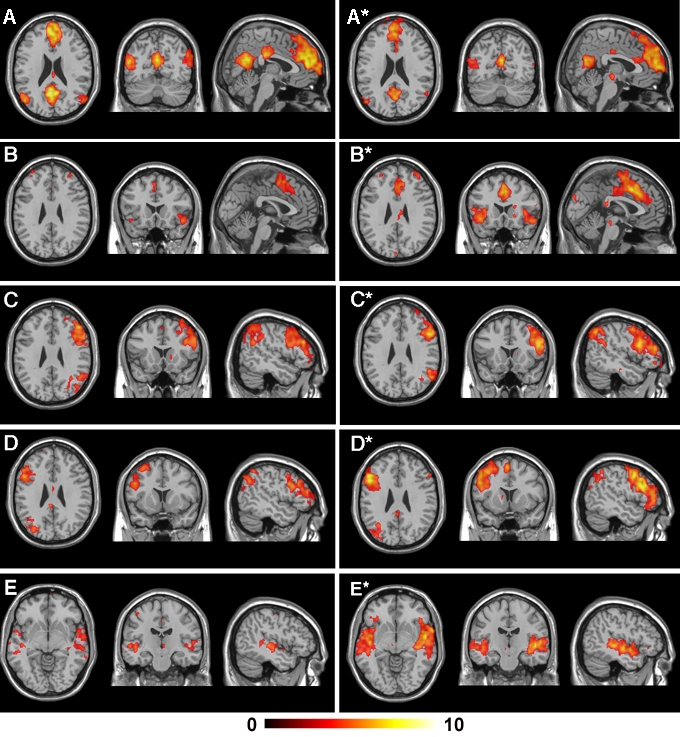
Global functional connectivity maps of the common RSN patterns that were identified in the mood induction experiments (p FDR <0.05). The left-most panel displays axial, coronal and sagittal views of the pattern under the neutral recall condition, while the right-most panel displays each corresponding pattern under the sad recall condition. All images are presented on a high-resolution single-subject MRI in standard neuroanatomical space (Montreal Neurological Institute, Colin-27). Corresponding color bars indicate the t score ranges of the displayed maps. Images are displayed in neurological convention (left = left).