
Figure 5. Cross-Correlation Analysis of Specific Resting-State Networks.
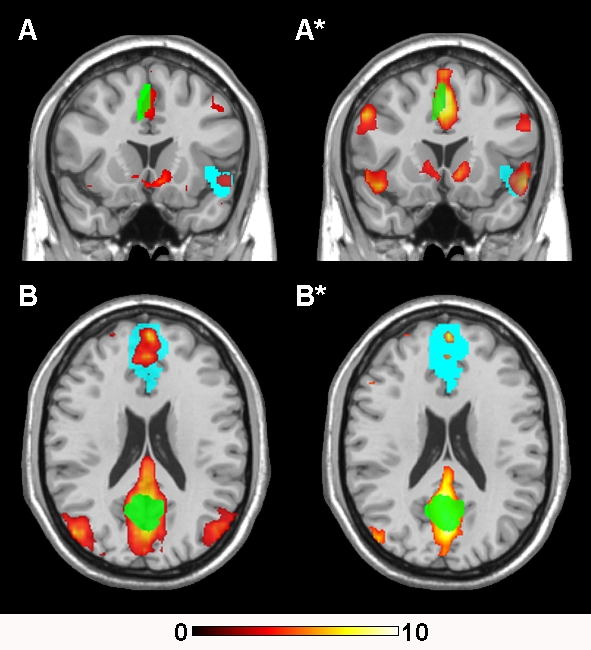
Regional functional connectivity maps of the ‘paralimbic’ (A) and ‘default mode’ (B) RSNs. Green clusters represent both of the seed ROIs while the blue clusters represent their respective target ROIs. Both ROI types are overlaid on the regional functional connectivity maps derived from the cross-correlation analyses. All images are presented on a high-resolution single-subject MRI in standard neuroanatomical space (Montreal Neurological Institute, Colin-27). Corresponding color bars indicate the t score ranges of the displayed maps. Images are displayed in neurological convention (left = left).