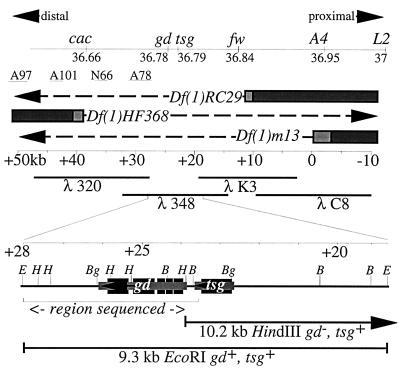
Figure 1.
Correlation of the genetic and molecular maps and the transcripts of gd and tsg. The top line displays the recombination distances in centimorgans between the loci in this region (cf. Materials and Methods). They are depicted according to their orientation along the X chromosome with proximal to the right. The approximate locations of breakpoints for several inversions were determined by Southern blotting as follows: In A97 (51.9/49.3kb), In A101 (44.5/42.5), In N66 (38.1/36.1) and In A78 (32/27.6). The bars represent DNA that is present in the deficiency chromosomes Df(1)HF368, Df(1)m13, and Df(1)RC29. The lightly shaded areas represent the uncertainty of the breakpoints, and the dashes indicate the DNA which is missing. The portion of the chromosomal walk used to identify the gd locus is shown immediately below the breakpoints with the extent of overlapping λ phage clones 320, 348, K3, and C8 indicated in kilobases. The positions of the 9.3-kb EcoRI and 10.2-kb HindIII transformation subclones are shown expanded below the chromosome walk as is the region that was sequenced. The sequenced region abuts other sequenced regions from the tsg gene and beyond. A partial restriction map of the 9.3-kb EcoRI subclone is displayed with E = EcoRI, H = HindIII, Bg = BglII, and B = BamHI. The extent and orientation of the 2.1-kb gd and 1.0-kb tsg transcripts are shown. The smaller lightly shaded blocks indicate the primary transcripts, and the protein coding regions are shown as larger darker blocks.

