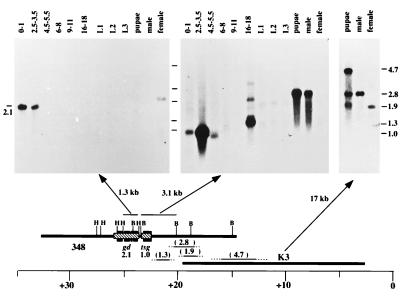
Figure 2.
Transcript map of the gd region. mRNA from stages throughout the entire life cycle were probed. The results obtained with three probes are shown here (i.e., a 1.3-kb HindIII and 3.1-kb BamHI fragments and the entire K3 phage DNA). The 2.1-kb transcript seen in early embryos (0–3.5 h) and faintly in females is the only transcript in the region with a developmental pattern consistent with the genetics of gd. It is the only transcript detected by the 1.3-kb HindIII fragment. The band in females and embryos is of similar size although this result is distorted here by a curve in the migration front. The 3.1-kb BamHI probe hybridizes to three bands whereas the entire K3 phage hybridizes to the 2.8-, the 1.9-, and a 4.7-kb transcript. Additional probing with other subclones permitted ordering the transcripts as shown (21). The tsg transcript has been identified by transformation (32). The 4.7-kb transcript likely corresponds to the furrowed gene (Corces, V.G., Johns Hopkins Univ., personal communication). The 2.8-kb transcript appears specific to males, and the 1.9-kb transcript is specific to females. From the hybridization pattern, we infer that these are likely alternative splicing variants of a single gene. The 1.3-kb transcript may have a large splicing variant as well. We have not yet identified any genetic lesions that may correspond to these transcription units.

