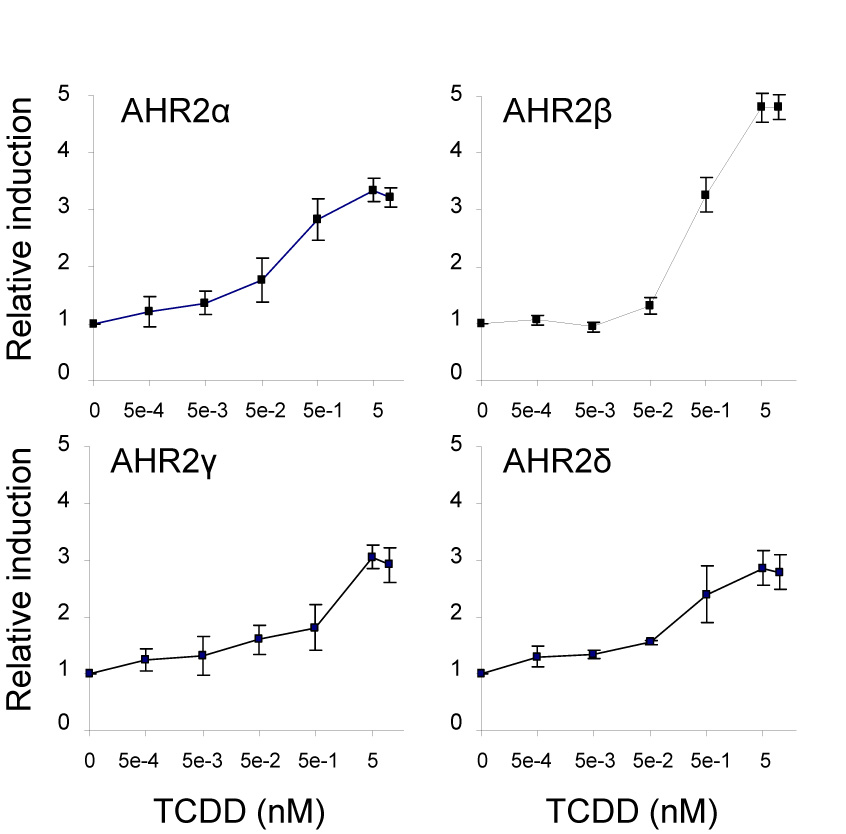
Figure 6.

Concentration-response curves for TCDD-induced reporter gene activation in COS-7 cells transfected with each of the Atlantic salmon AHR2 constructs: α, β (50 ng each), γ or δ (10 ng each) and cotransfected with pGudLuc6.1 (20 ng), pRL-TK (3 ng) and rainbow trout ARNTb (50 ng) expression construct. The cells were exposed to increasing concentrations of TCDD (0–10 nM). Relative luciferase units were determined by normalizing the firefly luciferase activity to the transfection control Renilla luciferase activity. For each AHR2, the relative fold induction values were then calculated by dividing the luciferase ratio for each TCDD-treated well by the mean ratio for DMSO-treated wells. All data are represented as the means ± standard deviation (SD) for three wells. The mean DMSO and TCDD (10 nM) luciferase ratios for each AHR2 were as follows: 16,3±5.4 and 51.6±6.1 (AHR2α); 20.8±6.5 and 99.9±14.1 (AHR2β); 55.1±2.1 and 161±9.9 (AHR2γ); 66.7±21.9 and 186±30.9 (AHR2δ). The mean fold-induction for DMSO and TCDD (10 nM) were 3.2 (α); 4.8 (β), 2.9 (γ) and 2.8 (δ), respectively. EC50 values were obtained by nonlinear regression. The calculated EC50 values for each AHR2 were: 0.10 nM±0.035 (AHR2α), 0.40 nM±0.01 (AHR2β), 0.52 nM±0.43 (AHR2γ) and 0.24 nM±0.035 (AHR2δ).
